
Carson City closed 97 homes in September 2026 at a $525,000 median, $107,514 under Reno, and 155 residential listings were active on November 11, 2026. 45.8% of that list has already been repriced, the third-lowest of the eight cut shares in this series.
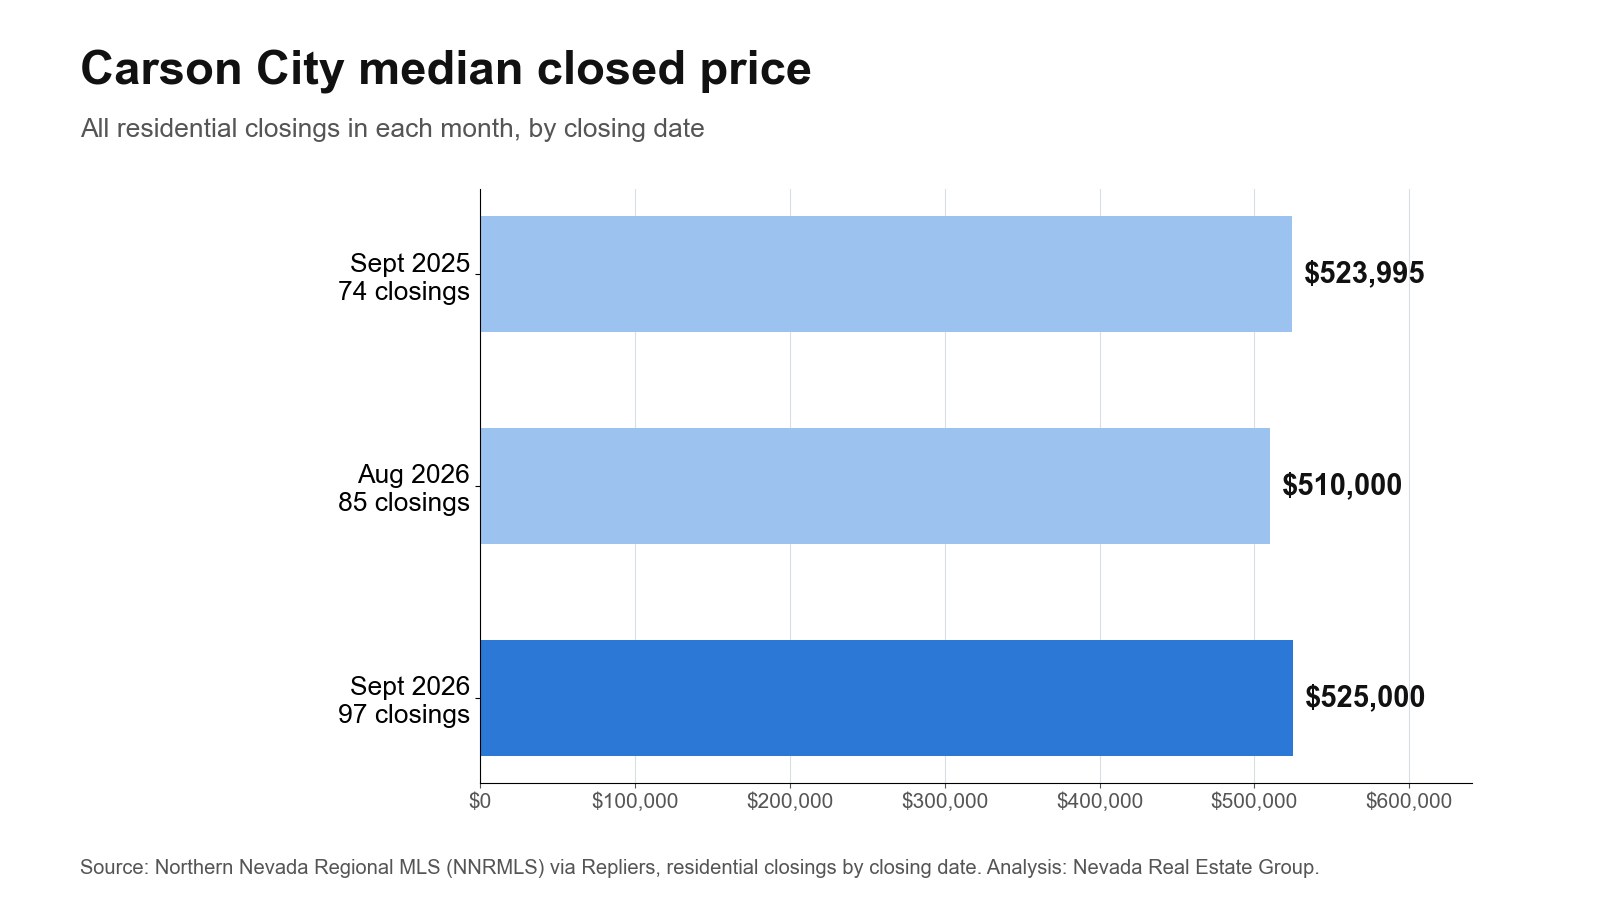
Carson City's median closed price was $525,000 in September 2026, per the Northern Nevada Regional MLS (NNRMLS) via Repliers, 97 closings. 155 homes were listed on November 11, and 45.8% of them had cut. The median closing still reached 100.0% of final list, so most of the bargaining shows up in the price cuts rather than at the closing table.
- Carson City closed $107,514 under Reno on 97 sales, with 155 homes listed.
- From August to September the median rose $15,000 (2.9%) to $525,000, on 97 closings.
- 89701 and 89706 sold fastest at 45 days, and 89703 slowest at 78 days.
- 57 listings are both past 60 days and already cut, 36.8% of the list.
- 45.8% of 155 listings had cut by November 11; 24.7% of closed homes had too.
What Are Carson City's Key Housing Numbers for November 2026?
| Measure | Figure |
|---|---|
| Condos and townhomes | $406,490 |
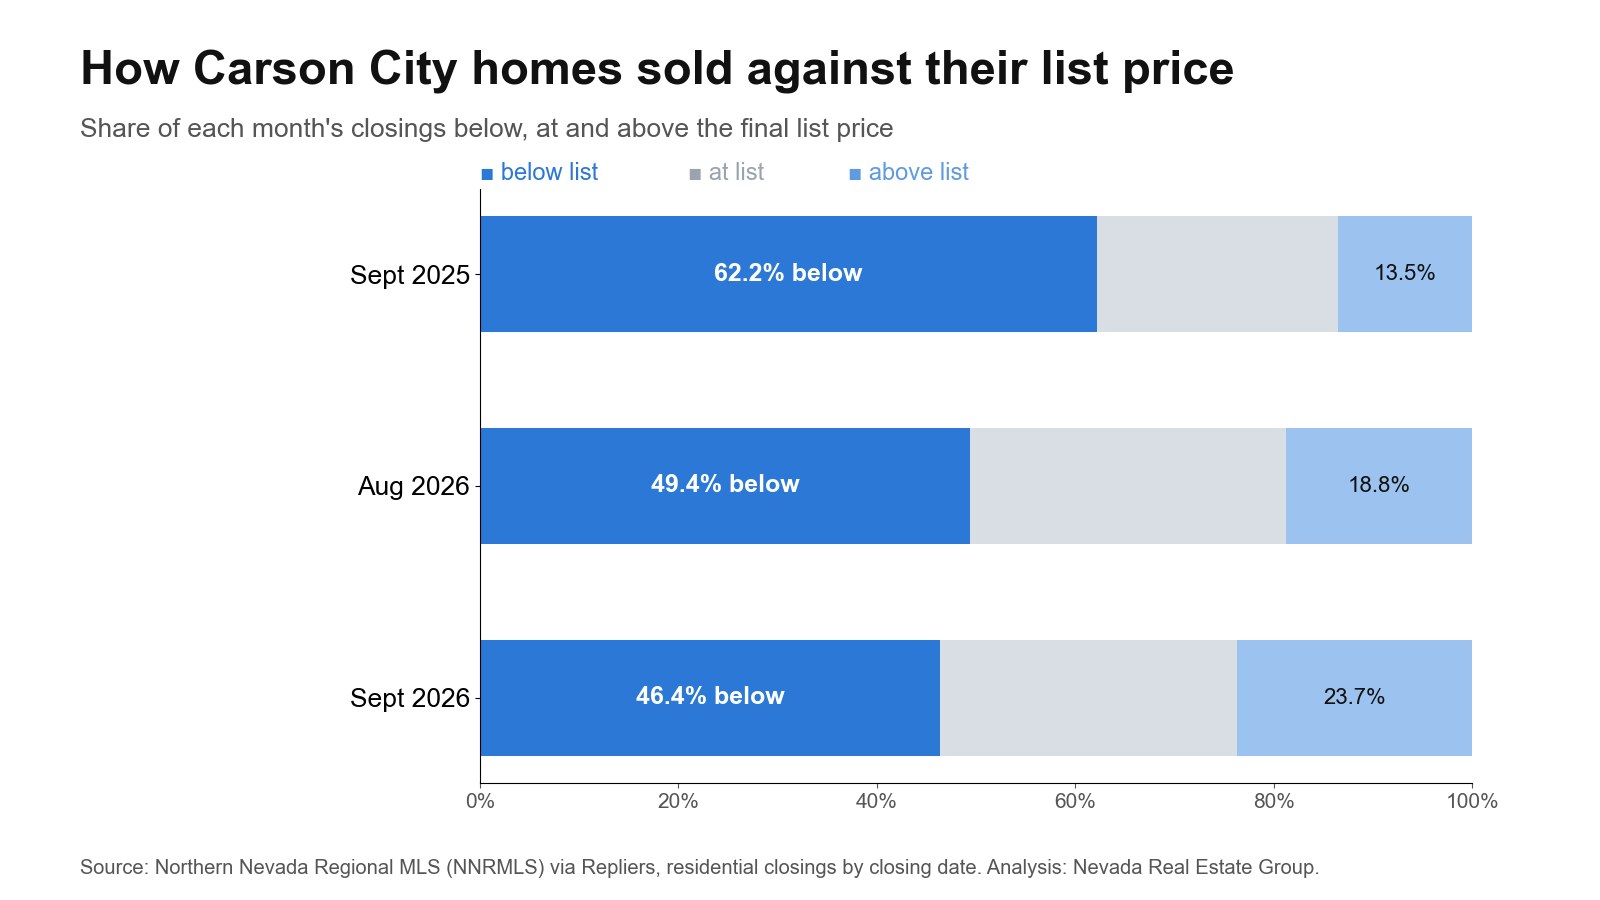
| Closed above list | 23.7% |
| Closed below list | 46.4% |
| Sale-to-list | 100.0% |
| Active listings | 155 |
| Houses | $598,000 |
| Listings with a cut | 45.8% |
| Closed per square foot | $305 |
| September median closed | $525,000 |
| Median ask | $550,000 |
| Listed 60 days or more | 52.9% |
| Median days, listing to closing | 56 |
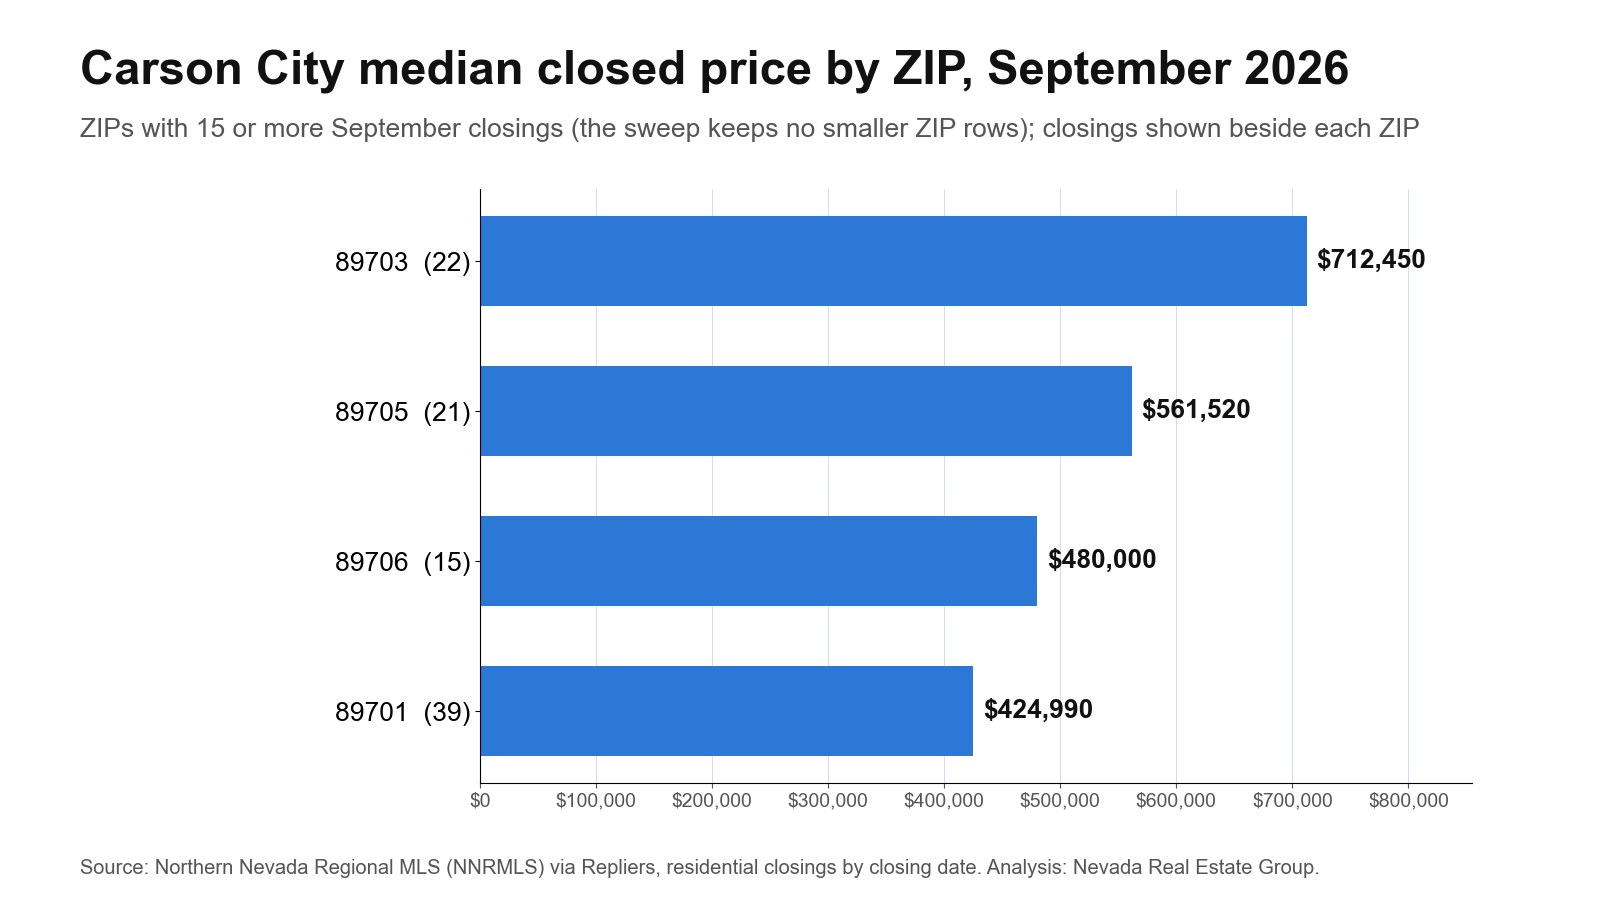
The figures follow the MLS city field for Carson City. No ZIP here has the 60 listings needed for an active-side row, so the ZIP table shows closings only. With four reporting ZIPs, the local range is easy to see: 89701 (Central and east Carson) closed at $424,990 and 89703 (West Carson) at $712,450. Fewer than 100 sales a month means any one of those rows can swing, so read two or three months together. The median house asks $605,000 against $384,000 for attached homes, and 27 attached listings is too few to support much of a trend on its own.
All of these figures come from the Northern Nevada Regional MLS (NNRMLS) via Repliers. With so few sales, the settled history on the Carson City market page tells you more than this one table, and it shows how much of a month's move is just the small sample. That page groups sales by the MLS sold date, which on this feed is the contract date, so its monthly figures will not match this report's closing-date counts.
How Did Carson City's Median Move Between August and September?
| Group | August | September |
|---|---|---|
| All homes | $510,000 | $525,000 |
| Houses | $588,315 | $598,000 |
| Condos and townhomes | $393,990 | $406,490 |
The all-homes median rose $15,000 (2.9%) to $525,000. Houses alone rose $9,685 (1.6%) to $598,000. A year earlier it was $523,995, which puts September 0.2% above September 2025.
Don't over-read one month. A median moves when the mix of homes moves, and 85 closings in August became 97 in September, so these are not the same homes. If houses and the all-homes figure moved in opposite directions, mix is the likely reason. The live Carson City market page has the 12-month series, which is the better guide to direction. October is not settled: 68 closings have posted at $540,000, so that is direction only.
There are 97 reasons to be careful with this number, one per sale. A few more homes from an expensive ZIP in one month, or a few more condos in the next, will move the middle of the list without any home changing value. That is why this report shows houses and attached homes apart, and why a change of less than about 2% in a market this size is best read as flat. A seller setting a price should give a recent comparable sale more weight than any monthly median, and a buyer should do the same when an agent quotes the trend.
Which Carson City ZIP Codes Sold Fastest?
| ZIP | Median days | Median closed | Cut share |
|---|---|---|---|
| 89701 (Central and east Carson) | 45 | $424,990 | n/a |
| 89706 | 45 | $480,000 | n/a |
| 89705 (South Carson and Indian Hills) | 57 | $561,520 | n/a |
| 89703 (West Carson) | 78 | $712,450 | n/a |
The median sale in 89701 (Central and east Carson) took 45 days from listing to closing, the same as in 89706. In 89703 (West Carson) it took 78 days.
For a seller, that gap sets how long a price can be tested before it needs to change. In the quickest ZIP, a listing past 90 days is already well behind the local pace. In the slowest, the same age is still behind. For a buyer, it sets how quickly you have to decide.
Fastest does not mean most expensive: 89701 (Central and east Carson) closed at $424,990 against $712,450 in 89703 (West Carson). Monthly ZIP clocks rest on few sales, so a single slow closing can shift a row. Read them as a guide and check the pace again next month. See any ZIP on the ZIP report index.
The busiest ZIPs in September, one line each:
- 89701 (Central and east Carson): 39 closings at $424,990, 100.0% of list.
- 89703 (West Carson): 22 closings at $712,450, 100.0% of list.
- 89705 (South Carson and Indian Hills): 21 closings at $561,520, 100.0% of list.
- 89706: 15 closings at $480,000, 98.8% of list.
How Many New Houses Are Coming to Carson City?
| Type | 2026 | 2025 |
|---|---|---|
| Single-family units | 101 | 192 |
| Units in buildings of five or more | 144 | 243 |
The Census Building Permits Survey shows 101 single-family units permitted in Carson City through September, down from 192 over the same months of 2025. A permit is a plan to build and not a finished home, so this number points to next year's competition more than this month's list.
For a resale seller, fewer permits mean less new competition coming. For a buyer, new construction is the alternative to weigh against the 155 homes already listed, and it comes with its own costs, from lot premiums to upgrades. Permits count the city's own permit office only, so homes going up just outside the line do not appear here. Our new homes page tracks what is being built.
For the newer month, Northern Nevada Regional MLS figures for October 2026, as updated November 8 and summarized by the Kinney and Renwick team on November 9, put Reno's single-family median at $667,500, up 4.4% from a year earlier, and Sparks at $625,000, up 10.6%, with 2.4 and 2.8 months of supply. Those are early figures from another brokerage's summary, not this report's own count, and the summary covers Reno and Sparks only. It gives no Carson City figure, so for Carson City the September closings in this report remain the latest settled count.
These counts cover what the city's own office issued, and homes in nearby unincorporated areas are counted elsewhere. For anyone buying here for the long term, the direction over two or three years matters more than one year's change, because that is what sets how much new competition a resale home will face when it is time to sell.
How Many Carson City Listings Are Both Old and Already Cut?
| Measure | Figure |
|---|---|
| Listings | 57 |
| Share of the whole list | 36.8% |
| Share of listings past 60 days | 69.5% |
| Median cut, all cut listings | $27,001 |
57 Carson City listings have been up 60 days or more and have also taken a price cut. That is 36.8% of the list, and 69.5% of the listings past 60 days.
Those are the homes where a seller has moved once and the market still has not answered. For a buyer they are the natural place to test a lower number, with one caution: age and a cut explain the seller's position, not the home's condition, so the inspection period matters just as much. Listings past 60 days with no cut are worth a separate look, since those sellers have not moved at all.
For a seller, the figure is a warning. If your home reaches 60 days without an offer, you will be compared with this group, and a buyer will already know what to ask for.
A home in this group may also be a relist, so check the full history and not only the current listing. Sellers here have often been at it for months and may have already moved out, so timing can matter as much as price. Ask your agent what the seller's real deadline is.
What Share of Carson City Sellers Have Already Cut?
| Group | Listings | Cut share |
|---|---|---|
| All residential | 155 | 45.8% |
| Single Family Residence | 123 | 47.2% |
| Condo / Townhouse | 27 | 48.1% |
71 of 155 listings, or 45.8%, were below their original asking price on November 11, 2026. That is the third-lowest of the eight cut shares in this series.
The figure counts sellers who have already moved. It does not say what they will take, and it does not cover the sellers who have not moved yet. Among homes that closed in September, 24.7% had been cut first, so a larger share of what is still for sale has been cut than of what sold, which fits homes that opened too high and are still working their way down.
A buyer should look at when a cut happened as well as how big it was, since a reduction last week means something different from one four months ago. Price history is on every listing, and it costs nothing to read before you tour.
For a seller, the number to take from this is competitive. About 7 of every 16 homes in your market have already shown buyers a lower price, so a new listing at an untested price stands out for the wrong reason unless it is backed by recent closings. Check the listings around yours before you decide where to open.
Do Carson City Buyers Have More Room Than Buyers Next Door?
| Market | Below list | Above list | Sale-to-list |
|---|---|---|---|
| Reno | 59.3% | 17.6% | 98.9% |
| Carson City | 46.4% | 23.7% | 100.0% |
| Sparks | 42.0% | 25.4% | 100.0% |
Reno has more, with 59.3% of closings below list against 46.4% in Carson City. Sparks has the least at 42.0%.
Below-list share is a better guide to negotiating than a cut share, because it measures finished deals. It still sits on top of different price levels: Reno closed at $632,514 and Sparks at $565,000, so a point of room is worth more dollars in one than the other. Nor does it mean a home two miles over the line would sell for less, since these are medians of different homes. The live pages linked in the table carry each market's trend.
A buyer who is free to shop across these markets can use that spread directly: the same offer strategy will not work in every row. A seller should read the table as a local expectation, since what happens next door has little effect on a buyer who has already chosen Carson City. Note the sale-to-list column too, because a market can have many sales just under list and few far under it, and that is a smaller concession than the below-list share implies.
Which Carson City Listings Should Buyers Look at First?
There are 57 listings past 60 days that have already cut, and they are the fastest way to find a seller ready to deal. Sort Carson City homes for sale by days listed, then open the price history on each one.
The fresh side deserves attention too. 12 listings arrived in the last week at a $444,950 median. If a new home is priced at or under recent closings, expect to move fast: the median September sale took 56 days from listing to closing. If it is priced over them, you can wait, because 45.8% of the list has already shown what often happens next.
The homes in between, up 30 to 60 days with no cut, are the hardest to read, so ask what feedback the listing has had. With 155 listings and 45.8% already cut, Carson City buyers can afford to look closely at each one. Under 100 sales a month also means fewer comparisons, so ask for all of them. The first-time buyer guide has the checklist for lining up a loan before you tour.
Keep your list short, since touring twenty homes tends to blur them. Pick five, read the price history and the disclosures on each, and go in knowing what the seller has already given up.
How Does Price Band Change a Carson City Sale?
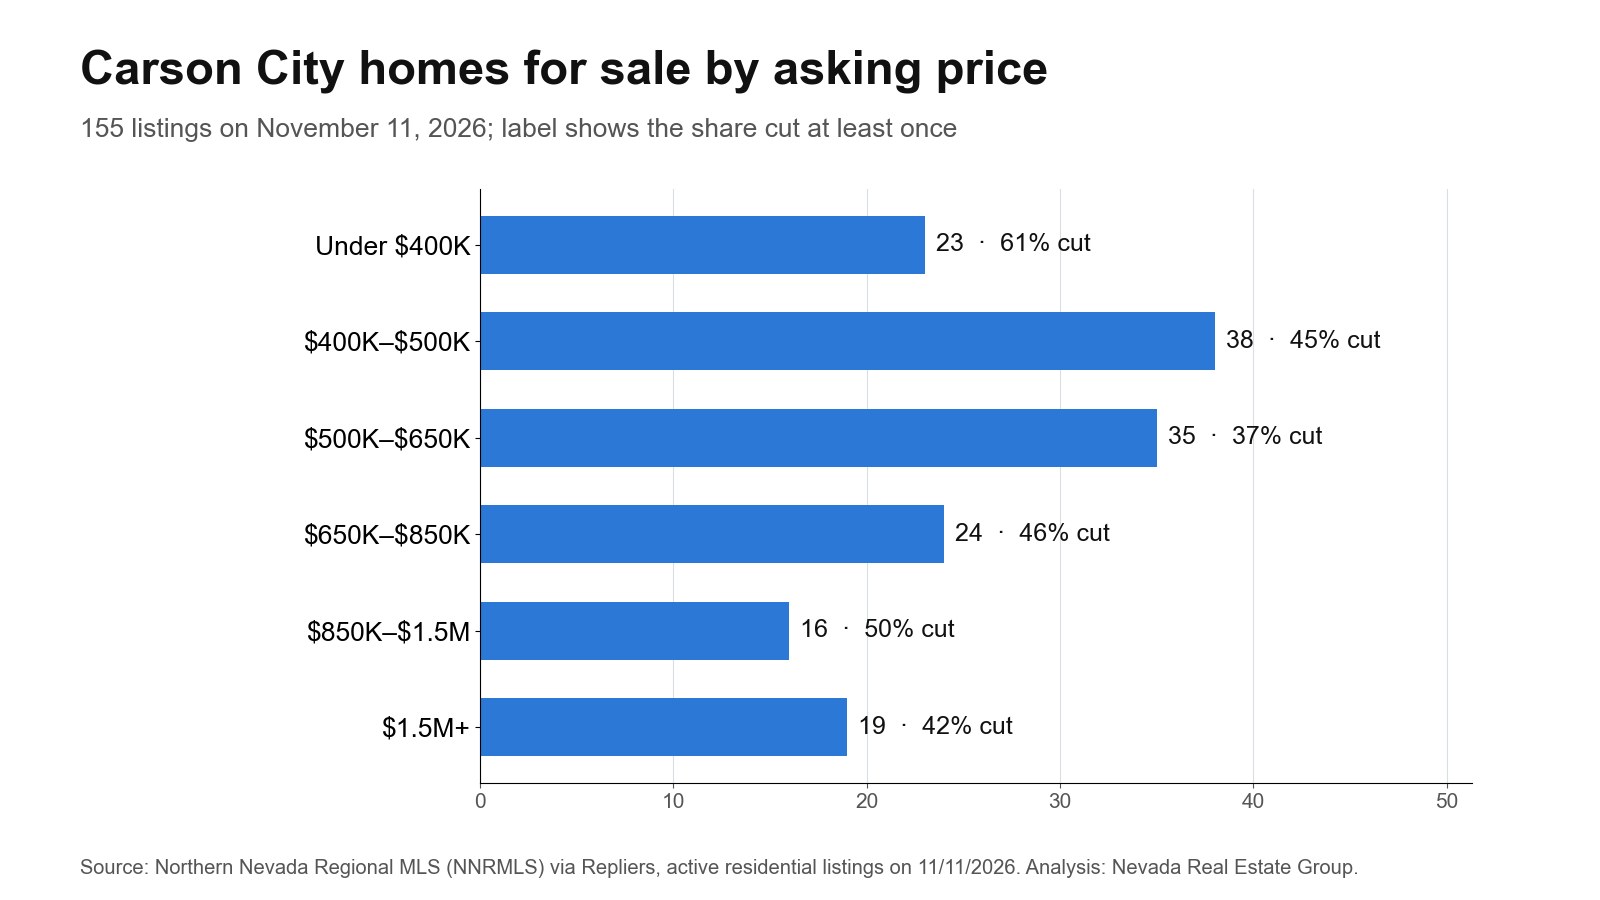
A seller in Under $400K is in a different market from one in $500K–$650K. 60.9% of the first group has already cut, against 37.1% of the second, and the typical home in those bands has been listed 72 days and 85 days.
Find your band in the list and count your direct competitors. In a crowded band, a price just under a round number can keep you inside more buyers' search filters. In a thin band, you may be the only home of your kind, but that also means fewer recent sales to support your price, and an appraiser will notice. Neither band makes a price right on its own. Closed sales near you do that.
Carson City has few comparable sales in any one month, 97 in September, so a single recent sale near you can carry real weight with a buyer and an appraiser.
If you sit near the edge of a band, think about which side of it you want to be on. A home at the top of a lower band can look like the best in its group, and a home at the bottom of a higher one can look like a bargain. Call or text (775) 277-2120 for a look at your band, or see our sellers page.
Remember that a band is only a filter. Two homes at the same price can be very different purchases, and the closest comparable sale still counts for more than the band does.
Will Carson City's Price Cuts Reach the Closing Table?
45.8% of Carson City listings have cut, yet the median sale reached 100.0% of final list in September. In other words, sellers are doing much of their adjusting before a buyer shows up. If that continues, the final price stays near list and the bargaining happens through reductions. If the ratio starts to slip below Reno's 98.9%, buyers have started asking for more on top of the cuts.
With 97 closings in September, this is a small enough market that one month can mislead, so wait for two or three readings. The list of 155 is the steadier figure to track. The October board summary cited above covers Reno and Sparks only, so the Carson City market page is the place to follow the settled months, and the housing guide has the context. A seller here should watch the two or three closest listings more than any citywide figure, and a buyer should read every price history, because that is where this market's negotiating has been happening. I would also watch the count itself: a run of months above or below 97 closings would say more than any one median.
Frequently Asked Questions
How much do homes sell for in Carson City?
Half of September 2026 closings went above $525,000 and half below. Attached homes centered on $406,490, and sales ran $305 per square foot overall.
Is Carson City a buyer's market?
It is roughly balanced: 46.4% of September closings landed below list, and 45.8% of listings have cut.
How many new listings came on in Carson City this month?
44 of the homes active on November 11, 2026 were listed in the prior 30 days, 12 of them in the final week.
How long do Carson City listings stay on the market?
The middle active listing has been up 68 days. 40.6% have passed 90 days and 16.1% are 14 days old or newer.
Did Carson City prices drop in September?
From August to September the median rose $15,000 (2.9%) to $525,000. A one-month change often reflects which homes sold as much as any change in value.
What income do you need for a Carson City home?
Lenders look at total debts, so there is no one figure. Start from the payment: about $3,241 a month in principal and interest on $598,000 with 20% down, at Freddie Mac's 7.18% 30-year average for the week of November 5, 2026, plus taxes and insurance.
Which Sources Inform This Carson City Report?
- Northern Nevada Regional MLS (NNRMLS) via Repliers: counted November 11, 2026.
- Freddie Mac PMMS: week of 2026-11-05.
- Census permits through September 2026 and the prior year.
- Northern Nevada Regional MLS October 2026 figures, summarized by Kinney and Renwick: the board's October 2026 figures.
- Our September 2026 report.
- More on Carson City: area guide, homes for sale, new homes, housing guide, market page, ZIP reports, buying, payments, down payment help, selling.
Listings are counted one by one on the sweep date, residential only. Closings are counted by MLS closing date, and a month counts as settled once its last day is 40 days old; a younger month appears only as provisional. Listing age runs from the list date. This is market analysis, not a valuation of any specific property.
The latest citable figures, with method, sample size and a downloadable chart, are on our Reno market data page. Based on information from the Northern Nevada Regional Multiple Listing Service® for the period September 1, 2025 through November 11, 2026.
Thinking of selling in Carson City? See how November’s numbers apply to your home